Visual electrophysiology recordings capture signals that span only a few hundred microvolts, making a high signal-to-noise ratio crucial for accurate assessment. Since these signals are so small, minimizing noise in the testing environment is essential. To address this, Diagnosys is introducing post hoc filters to improve signal quality for clearer presentation and interpretation in Espion Version 7. Let’s take a closer look at some of these new features.
Displaying the deviation from the mean of multiple scans
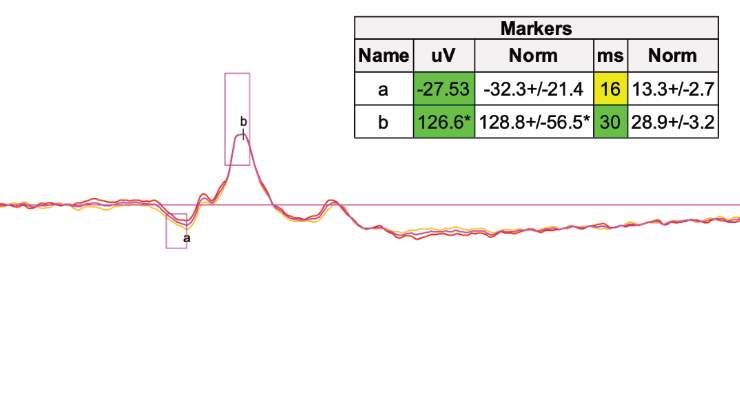
In a clinical setting, you can compare your data to reference data from a collection of reference patient responses. This comparison is visually represented as squares on a graph, with color-coded markers in the tables – green, yellow, and red – indicating standard deviations that fall outside the typical reference range.
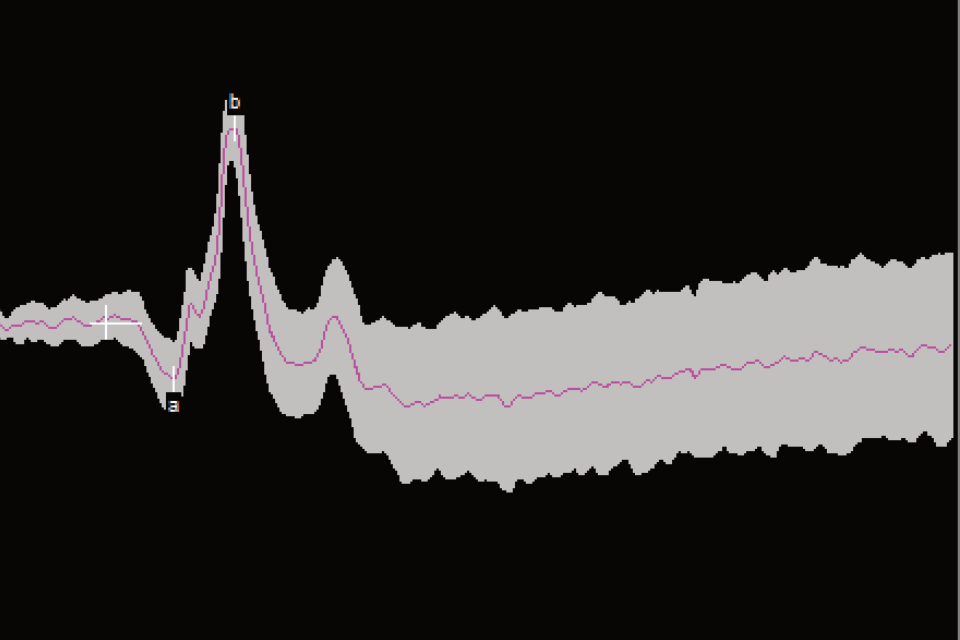
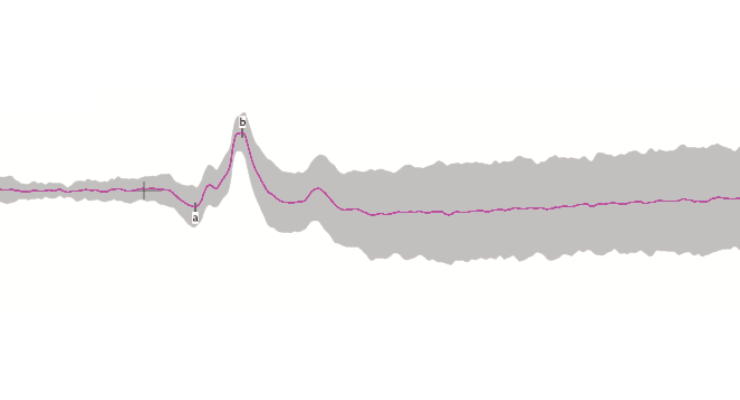
With Espion Version 7, you will be able to display the variation from multiple sweep recordings. In Figure 2, the gray zone around the solid line shown on the top curve represents the deviation from the mean of multiple measurements.
The frequency notch filter
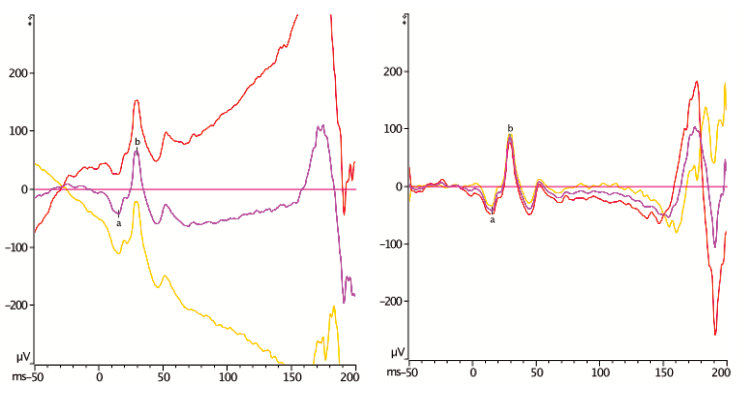
When you encounter a regular artifact that matches a specific frequency, you can use the noise removal filter to isolate and eliminate that exact frequency from your data. A Fourier transform can help identify which frequencies are present in the signal, making it easier to pinpoint unwanted noise. The frequency notch filter is particularly useful for removing common disturbances like 50/60Hz electrical line noise, as shown in Figure 3 below. The filter can also reduce artifacts from an animal’s breath or heartbeat.
The bandpass frequency filters
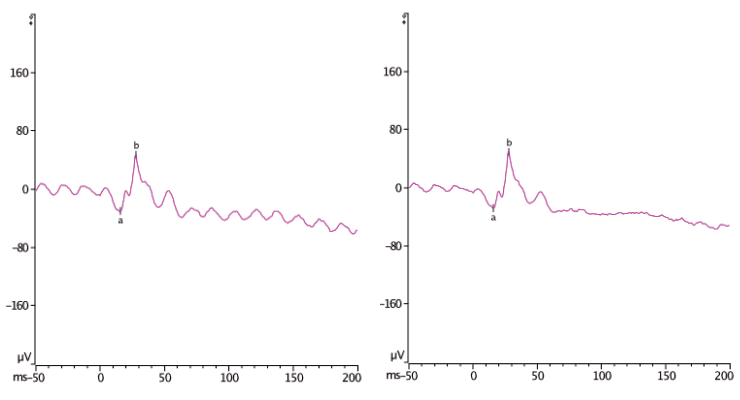
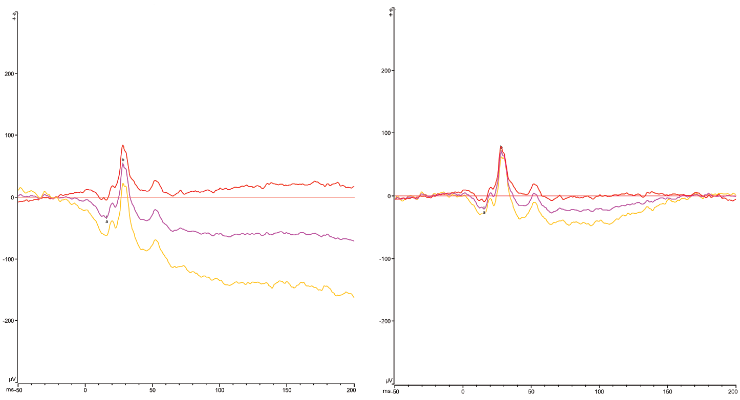
The International Society for Clinical Electrophysiology of Vision (ISCEV) has standardized the high and low frequency filters for all the standard electrophysiology tests. Yet, there are times when patient movements cause varying frequency noise, such as fidgeting children or adults wincing or tensing in response to the stimulus. The new post-hoc bandpass filter can be used to correct these artifacts. Figure 4 shows the effects of applying a low-cut filter.
The baseline drift removal feature
Ideal patient behavior requires the person to look straight ahead without moving their eyes while the stimulus flashes. However, it’s common for patients’ eyes to move off-center, causing the signal to shift vertically and displace the baseline during the measurement. The baseline drift removal feature corrects this by subtracting the slope of the waveform that is due to the patient’s eye movements.
All of these features will be accessible with Espion software Version 7 due to be released shortly. See it in operation in our Booth #1608 at ARVO 2025!